


What is Interaction to Next Paint (INP)?
Interaction to Next Paint (INP) is a Core Web Vital that measures how quickly a page responds when people click, tap or press a key. It looks at the interactions during a visit and reports one of the slowest. Google treats an INP of 200 milliseconds or less as good, 200 to 500 milliseconds as needing improvement and more than 500 milliseconds as poor. INP replaced First Input Delay in March 2024.
INP at a glance
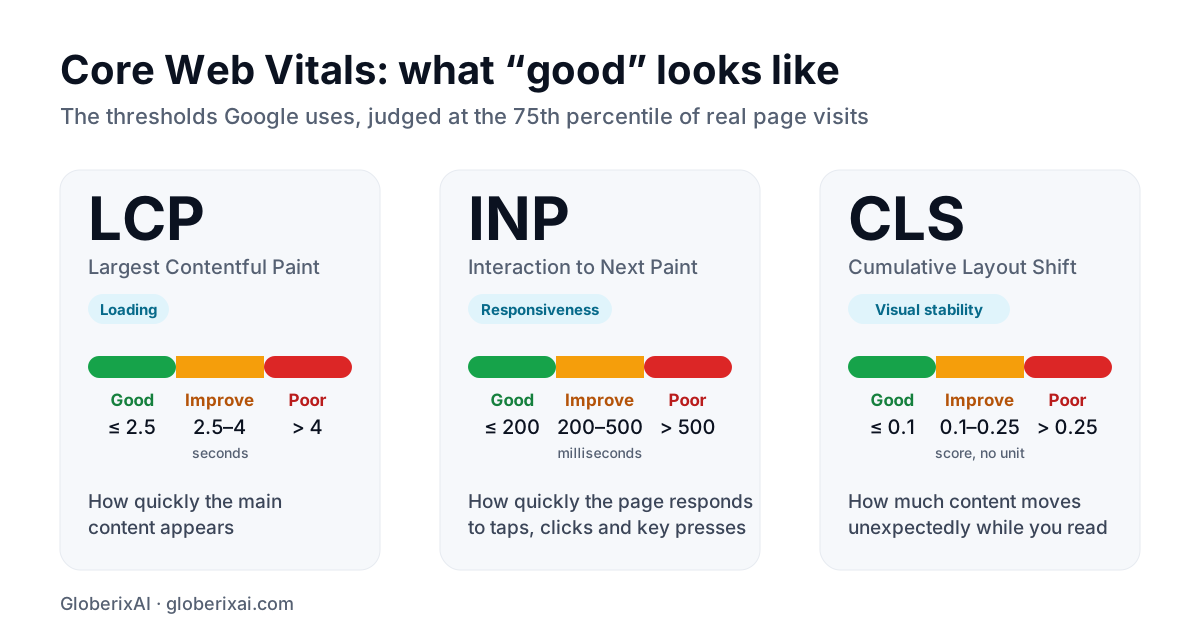
| INP | Rating |
|---|---|
| 200 milliseconds or less | Good |
| 200 to 500 milliseconds | Needs improvement |
| More than 500 milliseconds | Poor |
INP vs First Input Delay
First Input Delay only measured the delay before the browser could start handling the first interaction. INP measures the full time from the interaction until the next frame is painted, for the interactions across the visit. That makes it a much better picture of how responsive a page feels.
The three parts of an interaction
- Input delay: the time the browser waits, often because the main thread is busy.
- Processing time: how long your event handlers take to run.
- Presentation delay: how long the browser takes to update the screen after the handlers finish.
What makes interactions slow
- Long JavaScript tasks that block the main thread.
- Heavy hydration or too much JavaScript on the page.
- Expensive event handlers that do a lot of work before updating the screen.
- Third-party scripts such as tags, chat widgets and ads.
- Large, complex pages where each change forces a lot of re-rendering.
How to improve INP
- Break long tasks into smaller pieces so the browser can respond between them.
- Show immediate visual feedback, then do the heavy work afterwards.
- Ship less JavaScript and load code only for the interactions that need it.
- Defer or remove third-party scripts that block the main thread.
- Move heavy computation to web workers.
- Avoid forced layout and re-rendering large parts of the page for small changes.
- In React, use transitions or deferred values so urgent updates, such as typing, stay instant.
Key takeaway: Test with real interactions on a mid-range phone. INP problems often appear only on slower devices.
How to measure INP
A standard Lighthouse run does not click through your page, so it cannot measure INP directly. Use field data and interaction recordings.
- Search Console and PageSpeed Insights show field data from real visitors.
- Chrome DevTools lets you record interactions and see which part of each one is slow.
- The web-vitals library, with its attribution build, tells you which element and which part of the interaction caused a slow result.
Keep going
Read the full Core Web Vitals guide, then fix LCP and CLS. Our web development team and React developers build interfaces that stay responsive.
Frequently asked questions
What is a good INP?
200 milliseconds or less at the 75th percentile of real visits. More than 500 milliseconds is poor.
How is INP different from FID?
FID measured only the delay before the first interaction was handled. INP measures the full response time of interactions across the visit.
Why is INP high on mobile?
Phones have slower processors, so the same JavaScript takes longer to run. Test on a mid-range device and reduce main-thread work.
Can Lighthouse measure INP?
Not in a standard run, because it does not click through the page. Use field data, DevTools recordings or Lighthouse's interaction modes.